The original post is HERE.
 |
| European Electricity Prices in 2011 |
The data was sobering. Especially with how the price appeared to track the level of installed wind power within the country.
I intended to update this on a regular basis but for some reason the website stopped making the data available. Eventually I gave up trying and forgot about it.
By chance (as it is the year end) I was looking at the stats for this blog. I noticed that the old post on European electricity prices (now nearly nine years old) was still getting a fair amount of traffic.
So yesterday I went back onto the The European Energy Portal just in case they had any links to up-to-date data. The good news is that they have restarted providing the data. So now I can at least (after a delay of eight and a half years) update the original.
The readings today, after nearly nine years of rampant and virtually unconstrained development of industrial wind turbines and other RE make for even more sober analysis than before.
Here’s the new table of European electricity prices.
 |
| European Electricity Prices 2019 |
You will notice that the relative price between countries is virtually unchanged. Denmark still hosts the most expensive household electricity. Germany is again a close second. Sweden is today marginally cheaper than France but both have undergone significant price increases. Especially France which has politically disavowed its clean cheap and effective nuclear power in favour of yet more wind turbines.
Bulgaria still has the cheapest electricity in Europe with a virtually unchanged price. Interestingly Austria has also maintained its 2011 price.
Many European countries though have suffered large real-value increases in the price of their electricity. Often well above inflation.
The UK is a case in point. The is a period of eight years between the original post and the updated table. The price (in Euros) over this time went up from 15c to over 22c. That’s a rise of over 7c or a rise of about 50% unadjusted for inflation.
FROM HERE price inflation in the UK since 2011 to 2019 was 21%. So the rise in electricity prices in the UK over this eight year period has on average been at more than double the annual rate of inflation.
So why is this?
Maybe gas prices have gone up? (gas accounts for about one half of UK electricity generation)
No.
The gas spot price is actually cheaper today than it was in 2011, and by a considerable margin.
Is nuclear adding to the cost?
No.
In fact what nuclear there is left is now more efficient and cost effective than ever. Today nuclear power offers the cheapest electricity on the UK market.
Coal as a major UK electricity generating fuel is no more. It is a bit part player. Besides, the coal price (like the gas price) is considerably lower today than in 2011.
But there is a large new added cost since 2011 and that cost is associated with Renewable Energy.
There’s been lots of smoke and mirrors about how “cheap” wind power and solar have become but you only have to dig a little way into data to show the truth.
As the years have gone on the amount of subsidy to wind turbines you provide from your electricity bill has steadily gone up.
It is the old “boiling frog” approach to implementing a considerable price hike over time.
Disguised by the natural fluctuation of the market due to fuel price changes the price of electricity has been slowly and carefully ratcheted up over many years.
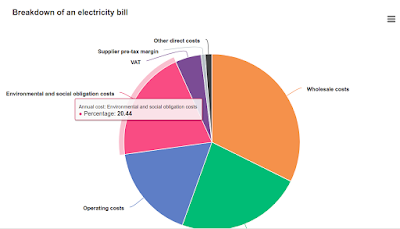
Today for every five pounds you spend on your consumer electricity bill, one pound is allocated to what is known as “Environmental and social costs”.
According to OfGem:
[quote]
These are the costs of government programmes to save energy, reduce emissions and encourage take up of renewable energy.
[unquote]
Of that 20%, the Lions share is used provide subsidy payments to Wind turbine operators and and solar PV owners. Mostly it goes on wind turbines.
The vast majority of these subsidy payments are made through what are known as ROC certificates. This is a subsidy scheme that is now obsolete but will still impact your bill for the next 20 or so years.
The RO scheme has been replaced by an even more duplicitous (and still lucrative) scheme called Contracts for Difference. But as of today ROC payments form the majority of wind turbine subsidy.
In other words the majority of the 20% added to your bill as “Environmental and Social Costs” is the amount you pay to subsidise wind turbines and to a lesser extent solar PV.
Paltry amounts out of this 20% go to improving home insulation or to providing remote locations with electricity.
So, you may be surprised to find that your annual electricity bill shows far less of an increase than this boiling frog price hike suggests.
This is because people now use less electricity than in 2011.
Why?
Because today we have more efficient appliances, particularly electric light bulbs, but white goods are much better too.
So just think:
All that money you spent on LED bulbs and eco-friendly washing machines has been used not to reduce your electricity bill, but to line the pockets of the big companies running wind turbines.
And it will continue to be used in the same way for the foreseeable future.
Today for every MWh of electricity produced the generating company must provide 0.484 ROC certificates. The value of a ROC certificate in 2020 has been set at £48.78 per ROC. This cost is passed directly through to the customer.
A typical consumer uses 3.7MWh electricity per year. Maybe you use more. Maybe less.
So work it out yourself how much you are subsidising wind turbines by.
I don’t think you will be amused.


No comments:
Post a Comment