The Obscene Profitability of Wind Power

Due to the pandemic and the virtual shutdown of the national economy the day-ahead wholesale price of electricity has plummeted. In May it averaged  £22.17 MWh. There have been occasions where the price has gone negative for several hours at a time. Normally the average monthly price per MWh is around £45.


As you can imagine this is really bad news for any generator that is dependant on the market price of electricity to support its operation.

But one group of producers has no worries.  

The subsidy payments received by generators classed as "renewable" dwarf these market prices. 

Here I’ll just deal with the most outrageous and costly i.e. windfarms. But biomass, Solar PV and others are all excruciatingly expensive too. Its just there's less of them.

The effect of the subsidy payments to wind-farms is such that until the price goes significantly negative it is not in their interest to shut down. They have privileged access to the grid so can demand access when the wind blows whatever the current grid status. But they suffer no penalty when they (often) fail to produce when needed. 

So in times of low demand and high wind they continue to produce. They only stop when they get bought off by the National Grid with what is known as a constraint payment. In 2019 wind turbine constraint payments came to over £139 million. Money for nothing – except to stop risking overloading the grid.

Today almost all wind-farms are subsidised by the now defunct Renewable Obligation scheme (RO). This was replaced in 2017 with Contracts for Difference(CfD) which is arguably even more costly and inflexible than its predecessor. 

ROC stands for "Renewable Obligation Certificate". Today one ROC is worth £50.05. Every time a wind turbine produces one MWh of electricity it gets the market payment for that MWh topped up an amount dictated by the RO scheme

A land based wind turbine gets 0.9 ROCs (£45.05) + Market Price for each MWh.

A offshore wind turbine gets 1.8 ROCs (£90.10) + Market Price for each MWh.

So back in May on average a land based wind turbine was in total being paid about three times the market price while an off-shore turbine was paid fives times the market price. In normal times they still (on average) get paid double and triple the market price per MWh respectively.

Even at times of oversupply, when prices fell to zero (or below) they were still guaranteed that subsidy – or an even larger constraint payment.

This RO subsidy scheme for wind turbines alone is currently costing UK customers £2.7 Billion a year and will continue to do so for the next 20 or so years. Here's the figures on the REF website

The companies running these wind-farms are over-joyed at their profitability. Truly when comes to acting as money making machines all other unsubsidised generation capacity pales by comparison. Look at this chart (HERE) from OfGem and weep.


So while renewable generation undermines the integrity of the grid it is obscenely profitable. 

Why is it so profitable? 

Because of a massively over-generous ROC subsidy. A subsidy which, at the end of the day gets paid by the consumer.

Years ago when the RO scheme was dreamed up, the idea was that the payments (i.e. number of certificates issued per MWh) would be changed as the technology/costs/profitability evolved. 

However this was only done once. When the ROC payments per MWh for on-shore and off-shore turbines were slightly reduced from 1.0 and 2.0 to 0.9 and 1.8 respectively it caused such a mountain of complaint from the renewable industry that it has never been attempted again. So today these vastly extravagant payments remain untouched. 

I suppose though we should be grateful that they are not on the new CfD scheme. This guarantees an index-linked fixed price. 

Current offshore windfarms using the CfD scheme are: 

  • Beatrice (g’teed £162/MWh) 
  • Burbo Bank Extension (g’teed £173/MWh) 
  • Dudgeon (g’teed £173/MWh) 
  • Walney Extension (g’teed £173/MWh). 

All of these make the RO scheme look cheap! These prices are index linked and so will only increase as time goes on. 

Of course today we have the wind industry crowing about “falling” CfD’s for future (i.e. jam tomorrow) wind farms. Much is being made of the proposed future Dogger Bank offshore scheme where the CfD auction was won at £48/MWh. 

But will they ever be built at that price? Besides that we are still lumbered with the excruciatingly over-priced one we have today!

A few years back there was similar huge publicity for Solar PV when CfD auctions were also won at around £50 MWh. It was headline news on the BBC and  all over the papers. Then after the razzamatazz, it all went quiet.

None were built. Just more unsubstantiated hype. More jam tomorrow. You have to give it to them though. It was wonderful propaganda.

Today the UK consumer (and industry) are literally being robbed by the big energy companies and their renewables scam. Large companies stack up huge profits from wind farms. Not because their wind turbines are wonderfully efficient (far from it) but because they are hugely subsidised

There is no excuse for this. The RO scheme was designed to be flexible and take into account the varying profitability of renewable generators. But today  it has ossified to the benefit of financial parasites.

If the UK govt had any balls it would cut the ROC (at least) in half and phase it to zero within 5 years.

But you know and I know that won't happen. Wind turbines are simply too fashionable. Nobody dares question their economics, or who actually ends up paying for this extortion racket.

So just get used to being robbed for the next twenty years. You (and I) have no other choice.

But perhaps we don't have to stay quiet while our pockets are being fleeced.


The Trouble with Heat Pumps Part 4

This is the last in a series of four posts where I have tried to challenge some of the over-selling and hype surrounding heat pumps. The start of this four post series is HERE.

In this post I want to look at the concept some people promote of a mass national replacement of gas boilers with heat pumps.

The purpose of this mass adoption would be to replace the current usage of natural gas for domestic heating. This would be done solely to cut Carbon Dioxide emissions. It would serve no other purpose. 

Currently 85% of UK homes are heated by natural gas. So this replacement concept is not for the faint hearted.

Last year domestic gas use was 310 TWh.  (Cooking accounts for under 3%) (DUKES spreadsheet HERE)

Meanwhile the entire national usage of electricity was 324 TWh (DUKES pdf Here)

In other words, gas usage for domestic heating (mostly over a short 4 month period) more-or-less matched the entire electrical generation of the UK for all types of use over the full year.

So if we assume that domestic heat pumps can deliver 3:1 energy output when compared to gas, then nationally we will need an extra 100TWh/year of electrical generation to drive their compressors. (The 3:1 is a big assumption – See last post Here)

An extra 100TWh is roughly equivalent to an increase on current generation of 30%. This though does not account for the fact that most of that 100TWh will be required over a four month period and the generation capacity will be surplus to requirements in the summer. But never mind.

So how can this be powered? Of course the "green" solution would be to use solar and wind. In my opinion neither solar or wind could remotely address the demands placed on them for this. But never-the-less, lets look at them and skim over their lack of capability where possible.

Solar. Sadly the incapability of solar in winter is so marked it is impossible to skim over it's failings. In winter there is little sun. So there's little electricity generated. It's probably best for me to let the Centre Alternative Energy explain it to those who disbelieve me. (HERE - see Q&A at end)

Wind. Currently the existing Wind turbine fleet intermittently generates about 20% of current UK demand. There are, in total around 11,000 wind turbines both onshore and offshore in the UK. If we forget about intermittency, grid connectivity, site availability, storage, sea bed damage and impact on those living nearby we would need another 16,500 turbines, just to cover domestic heat pump use in homes.

 The current wind fleet has cost well in excess of £50 Billion to build and only functions due to massive on-going government subsidies. An additional 16,500 turbines would add another £75 billion.  But it doesn’t stop there. Increasing the carrying capacity of the Grid  as well as connectivity, backup supply and cabling would add at least another 25 – 50 billion.  Say a £100 billion all-in – and that, I would suggest, would be wildly optimistic.

But really that is small beer compared to the cost of installing the heat pumps themselves.  Half of the cost is installation and groundwork and so is fixed. Even if we assume the price of the hardware halves we are still looking at £12,000 per installation averaged across GSHPs and ASHPs.

Lets assume the target installation is in 19 million homes.  (As suggested on record by  Committee on Climate Change and also stated HERE ) So the cost of installing heat pumps in these 19 million homes comes out at a whopping £228 Billion.

So all in, to convert 19 million homes to heat pumps would cost well in excess of £325 billion.

In essence we would be spending over £325 Billion to  replace a perfectly serviceable (and more capable) gas supplied heating system. We would be doing this in order to cut Carbon Dioxide emissions from the cleanest fossil fuel available while plenty of dirtier targets remain.

Even if you substitute in more realistic and capable methods of generation (like nuclear - or even gas!) the figures are still ruinously huge. 

Reduce the adoption rate the figures remain ruinous, just less so. It is only when you get to very low rates of adoption (like today) that the pain reduces and heat pumps can run off existing electrical supply without the need for more infrastructure. 

Mass adoption of Heat pumps to replace gas boilers is a non-option. They are less capable and cost far more to install and run than the condensing gas boilers they are supposed to replace. Even so, there are lunatic plans in place to ban new gas boiler installations in new build properties by 2025. (See Here) 

On the plus side heat pumps do make great talking points down the golf club or in a Green Peace meeting and are marvellously fashionable and very, very politically correct. Sadly though when it comes to heating the average home they are not in the same league as condensing gas boilers.

Without the governments bribe Renewable Heat Incentive, uptake would peter-out to nothing. The zealots and the rich would baulk at the cost. Even with the current bribe the take up rate is so pitiful that it would take 700 years to replace all 19 million gas boilers

So how can we reduce Carbon Dioxide? More to the point how can we reduce Carbon Dioxide at significantly less than £500-£600 a tonne? These are difficult questions. 

But clearly, heat pumps do not provide the answers. 

To pretend they do is criminally irresponsible.


The Trouble with Heat Pumps Part 3

The last couple of posts I have looked at Ground Source Heats Pumps (GSHP). (See HERE)

This post deals with Air Source Heat Pumps (ASHP). Like their more expensive (and more capable) GSHP cousins, ASHPs are the subject of the most incredible wishful thinking, promotion and propaganda. This is what I hope to address here.

An ASHP (as the name suggests) takes its heat source from the air rather than the ground. Consequently instead of having a pipe system buried under the lawn there is a large out-door box with a fan that pumps air past a heat exchanger. It is significantly less expensive to install than a GSHP and requires minimal ground work. i.e. Maybe the laying of a concrete pad for the system to stand on.

There are in fact two types of ASHP. The most common is a wet system which I highlight in this post. This delivers the heat to water which is then used to transfer the heat to the house like a traditional central heating system does. 

The second type is a dry system that delivers the heat to the house as heated air. This system does not usually provide hot water. As I understand it, due to the additional problems a dry ASHP has when heating both home and hot water the government do not provide access to the  bribe Renewable Heat Incentive for a dry system. 

With an ASHP you still need a garden, or at the very least a suitable outside wall. As the things have an intermittently rotating fan (and so make noise) their location has to be in such a position it won’t annoy the neighbours. Or annoy the owner for that matter.

The installation costs are well below that of a GSHP.  This table from Tradesmencosts.co.uk HERE suggests the cost is about half that of a GSHP. 


To make the system effective you will also need to install underfloor heating or (at least) increase the size of your radiators. In essence, you would need to completely rebuild your central heating system. Then I'd suggest you would need to redecorate. Most sites also recommend you upgrade your household insulation. None of these extra costs are included in the figures in the table above.

The big issue with ASHPs is that their heat source (the air) is not always at a positive temperature. When ASHPs are required to work the hardest (cold weather) their efficiency is compromised. Even so, you will often find ASHP COP values, obtained during almost ideal conditions being used to promote their use year round. (like HERE)

With all heat pumps we really (really!) should NOT assume the COP value is a good indicator of their overall efficiency or capability. A far better figure is the SPF (Seasonal Performance Factor). 

Further-more we need to ensure we use an SPF that is calculated using the full system (H4) NOT simply for the heat pump itself (H2 or even H1) which ignores energy used by backup/boost heaters, immersion and the fan. Here is a diagram (from HERE) that itemises the difference between SPF vales for H1, H2, H3 and H4


I suspect that even if we use (as we should) SPF(H4) this still does not take into consideration the energy that is sometimes needed to de-ice ASHPs in sub-zero temperatures.

A realistic value for the SPF(H4) for a ASHP is 2.44. 

This is the median value obtained over a large 2017 DECC  sponsored analysis  (contractors RAPID-HPC) of many hundreds of of ASHP installations. The data was collected between 2013 and 2015. (Report HERE)

Notice that this is actually below the current minimum value Ofgem (SPF - 2.5) stipulate for claiming the bribe Renewable Heat Incentive! 

From the graph below it looks like the majority of ASHPs analysed by DECC are operating below and in some cases well below an SPF of 2.5. I'd put money on it though that they all successfully claim the RHI subsidy (or the then RHPP equivalent).

ASHPs are on the left and GSHPs on the right right. Notice the ASHP results are significantly weighted to the lower performance values. 

Heat Pump spread of SPF values DECC

"cropped" means these graphs above have excluded very low and high values. 32 sites (25 ASHP 7 GSHP) were excluded. Of those, 29 had an SPF(H4) less than 1.5. Only 3 had an SPF above 4.5

Like GSHPs, ASHPs typically provide output hot water to the central heating system at less than 40 degrees C. (The Centre for Alternative Energy (HERE) suggests 35 degrees C is best.). 

For most installations domestic hot water needs supplementary heating. There are reasons beyond simple comfort for this.  (Note: gas hot water is usually 65+ degrees).  

Temperatures around 35 - 40 degrees C are the ideal temperature for growing Legionnaire bacteria. So additional water tank heating to 65 degrees C (using an immersion heater) to kill them off is an absolute necessity once a week even if you are happy with luke-warm hot water most of the time. (This applies to GSHPs too)

If you are changing your heating system to use a heat pump, changes have to be made to accommodate the low temperature output to the heating system. The user is recommended (HERE) to install underfloor heating. Or if they cannot afford that, then maybe they can install bigger radiators. DECC found the cheaper heat pump upgrade option (larger radiators) reduced the system efficiency by about 10%. compared to underfloor heating. 

Empirically (based on a sample size of nearly 400 units) the DECC study found costs associated with running a ASHP system were significantly more than that of a GSHP. They only draw on parr when the external temperature is around 10 degrees C or more. Which is, of course, at times when central heating is less likely to be needed. 

Both ASHPs and GSHPs are more expensive to run than a condensing gas boiler.

Incredibly, Greenmatch (HERE) even using a COP of 4.3 (!!) still found condensing gas boilers are cheaper to run! Imagine how the figures come out if you use DECC's most commonly achieved SPF(H4) value of 2.44.

Carbon Savings

ASHPs are less effective in cold weather than GSHPs. This inevitably will be reflected in their potential Carbon Dioxide savings against condensing gas boilers.  As a GSHP will save less than 2 tonnes of Carbon Dioxide per household per year compared to a condensing gas boiler it is difficult to see how an ASHP would save more than around 1.2 - 1.5 Tonnes.  

The average expenditure needed to prevent the emission of Carbon Dioxide (per tonne) gets compensated somewhat because ASHPs are cheaper to install than GSHPs. But I would suggest the gains and losses more-or-less average out and the cost will again be round £500 per tonne.

However there is the opportunity to  participate in the governments bribe Renewable Heat Incentive! So other people in essence will pay in part for your heating system. 

All of this for both GSHPs and ASHPs pre-supposes that the National electricity Grid will simply ramp up output to take over from gas if there is mass adoption of heat pumps.

Unfortunately most people do not realise how little energy the electrical grid provides to domestic consumers compared to that provided by the gas grid. Neither do they appreciate how a mass adoption of heat pumps (let alone EVs) will impact it. Or how much in total it will cost the country

That’s the subject of my last post in this series on Heat Pumps. (Here)

The Trouble with Heat Pumps Part 2

Last post (HERE) I looked at the overall cost of installing ground source heat pumps (GSHPs) and how much land was needed. I touched upon other issues too which I will expand on here.

The first and most obvious issue with domestic GSHPs is simply their incapability. A typical domestic GSHP has an heat output of 4KW - 13KW. The most powerful have an heat output of about 16KW.

Compare that to a standard modern condensing gas boiler that has a heat output of somewhere between 20 – 50KW.

This low output from GSHPs has a number of consequences.

    • The typical water output temperature fed into the heating system is less than 40degC. You can increase that. But if you do the efficiency rapidly decreases. ( a gas system typically produces hot water at 65 degC or more)

    • With a GSHP it is difficult to get domestic hot water for the bath/sink/shower up to an acceptable temperature. The usual fix is that you use a standard electric immersion heater to raise the temperature to an acceptable level. 

    • Because the output temperature is so low, the recommended usage for central heating is in under-floor heating. So factor installing that into the installation costs as well.

    • If you decide to ignore the under-floor heating recommendation and use radiators it is recommended you increase their size. Either way, underfloor or larger radiators - you trash your decor and need to redecorate. Factor the cost of that in too.

    • The system has to be running 24/7. You cannot allow the house to cool down when empty as it takes so long to heat up due to the low heat output.

   • When the system does reach temperature, as the hot water heating the underfloor system/radiators is at a lower temperature than a gas system, the system cools more rapidly and so tends to cycle on/off/on/off more frequently than a conventional system.

    • Every site (I have seen) that recommends GSHPs always encourages the owner to increase household insulation during installation (more cost). Meanwhile any cost comparisons they perform are with obsolete gas/oil/electric systems like this one taken from  (HERE)

heatin cost comparison GSHP and old systems
So - Wheres the comparison with a new condensing gas boiler?

I have never seen a headline comparison of GSHP with (say) a condensing gas boiler system in an equally well insulated house. It is always old obsolete systems. I suspect the reason for this is because it is actually cheaper to run a modern condensing gas boiler system than a GSHP. (more later)

So, the take out from this is that:

    • On a like for like basis GSHPs are not as effective as gas boilers when it comes to heating your home. They can do it. But in reality, condensing gas boilers are more capable (and cheaper to run).

    • To get acceptable hot water temperatures while using GSHP you either compromise the lauded efficiency of the GSHP or use an immersion heater. Either way the overall system efficiency takes a nose dive.

     • You need to factor in a complete ground-up rebuild of you houses heating system with all the decorating and associated building/plumbing work. Your garden will be trashed and need to be re-layed. This will be on top of the cost of the GSHP installation. 

    • The system runs 24/7. It needs to do this as it will take a long time to heat up your home again if you let it cool down. So if you plan to solely rely on cheap Economy 7 electricity to drive the compressor – dream on.

    • There’s mountains of deception and propaganda being peddled by people and organisations promoting heat pumps. Make sure you get the all the figures and make sure their comparisons are honest ones (they won’t be).

Running Costs

OK let’s assume you have overcome the installation restrictions as outlined in the first post in this series. 

You’ve sold the kids into slavery and spent your £20,000 - £30,000+ on a GSHP plus associated rebuild of your heating system/redecorating/relaying garden.  Let’s say it works satisfactorily (some don't).

How much are you going to save?

Here’s a table from Evergreen Energy (HERE)


So from this rather optimistic table we find KW for KW a GSHP has just short of 4 times the efficiency of gas. So far so good you may say. What’s not to like about that? For one KWh of electricity used by the GSHP provides 4KWh of heating. If its gas we need 4KWh of gas. 

(As I'll show later this efficiency of 350% for a GSHP is wildly optimistic and does not stand up to scrutiny when compared to actual real data from a large installation base - but never mind for now. We'll run with it as-is)

The trouble comes when look at a typical gas/electricity tariff like this one. (Its mine by the way)


Notice the electricity price for one KWh is over six times that of gas. True you need a second standing charge which will slightly increase the gas price. But not by much.

So, let us assume the choice is between replacing an old gas boiler with a £2000 new condensing gas boiler or paying out £20,000 for a GSHP system and another £10,000 for the associated rebuild of your heating system, garden and decor.

At the end of the day (day-to-day running cost-wise) you would still be better off with the condensing gas boiler. 

Subsidies.

The government wants to entice you to spend your money on a GSHP. This is so the government can grand-stand about how “environmental” it is. As a consequence the government will issue you with a big fat subsidy if you install a GSHP. It’s called the Domestic Renewable Heat Incentive (RHI).

Now subsidy is a funny word. 

Many people think the word "subsidy" is actually an abbreviation for “somebody else’s money”

I couldn't possibly comment.

Even so, the subsidy, (which will be payable for 7 years) won’t cover the initial cost of the GSHP let alone the extra money you’ll pay out on rebuilding your heating system, or on enhanced energy bills. It's considerably cheaper to leave the bribe with the government and buy a condensing gas boiler.

Carbon Emissions.

Ah – right! This must be a slam-dunk for GSHPs. Surely no government would ever propose a “green” solution that was (well…) less than it was made out to be? 

To be fair this is one area that GSHPs does win out over gas. But not by as much as some would have you believe.

First let's visit what the real efficiency value is rather than the promoted value. 

Usually, the value promoted by advocates of GSHPs is the COP (Coefficient of Performance) and usually they use a COP value obtained in more-or-less ideal conditions. They then use this idealised value to figure out both savings and emissions for the whole year. 

First of all, if we want a realistic figure we shouldn't use the COP at all. We should use what is known as the SPF (Seasonal Performance Factor) which is roughly the performance you would get over a year rather than just at ideal conditions. We then need to ensure the SPF also includes the bits that the COP ( and heat-pump protagonists) studiously avoid. Like hot water immersion heaters and the need for other in-built resistive heaters in cold conditions to boost the sagging room heating performance of the heat pump itself. 

DECC did a study of several hundred GSHPs and ASHPs (Air Source Heat Pumps) in 2017. (HERE) 

They found the typical (median) SPF for a GSHP was actually 2.71. 

Here's the DECC graph for the distribution for H4 (H4 is the full input/output from the GSHP system rather than just a sub-system of it). The data we are interested in this post is the right hand bar graph.

If you want to understand the differences H1,H2,H3 and H4 for heat-pumps read THIS paper


So now we find we need just under 3.0KW of gas (condensing gas boiler) to match  1KW electricity used by a GSHP. Surely that is still (nearly) a 3 - 1 win? 

Well, no. You still need to factor in the carbon emissions from the electricity generation – and transmission losses for both electric and gas.

From Carbon Independent (HERE) we find that, after accounting for transmission losses and leaks, UK electricity has a footprint of 0.309Kg/Kwh and gas 0.203Kg/Kwh. So now we are down to less than 2:1. Which, to be fair is still a gain. For today at least. 

If you work it out it comes out at less than 2 Tonnes of CO2 saved for the average house over a year if the comparison is with a new condensing gas boiler.

The problem here is that this still ignores the main inherent issue with GSHPs. Namely the low power output. If people start supplementing their meagre GSHP output with electric or calor gas heaters and regularly bump up their hot water temperature with immersion heaters, all bets are off.

So (maybe) a gain. But at what cost? Somebody has to pay the £20,000 even if some of the cost is spread across society (including the poor) with the government subsidy.

So let us  assume the carbon dioxide saving is (optimistically) 2 tonnes per household and the GSHP lasts for twenty years without needing repair and only costs £20,000 to install. 

(Be aware that ALL rotating machinery needs care, repair and maintenance over time. The suggestion from the Green lobby that heat pumps last “forever” is simply absurd propaganda. )

The initial capital cost over 20 years averages at least £1000 per year assuming zero interest. So each tonne of Carbon dioxide saved has cost a minimum of £500 just in up-front capital overhead alone.

Which must be not far short of a record. 

You need a big garden for a GSHP.  So basically poor people need not apply. But big gardens usually come with rich people attached, ready and willing to claim the big fat subsidies. Even then they'll be out of pocket.

This government subsidy (like most renewable bribes) is in fact a Dennis Moore tax. I am sure we all remember good 'ol Dennis Moore. 


Next I’ll look at Air Source Heat pumps. 

It doesn’t get better. (HERE)


The Trouble with Heat Pumps Part 1

Domestic heat pumps are being heavily promoted by energy companies and the Green lobby as an efficient way to cut carbon emissions while simultaneously reducing  consumer energy bills. 

But do the figures really stack up? In fact is either of the above claim true? Or are the promoted advantages of heat pumps based more on wishful thinking than reality?

There is so much hype going on around Heat Pumps it is difficult to separate the facts from propaganda. But as this topic has been bugging me for some time I thought I would have a go and maybe puncture a few of the propaganda bubbles and economies-of-truth surrounding heat pumps. 

So here goes.

There are two main types of domestic heat pumps. Ground source heat pumps (GSHP) and air source heat pumps.  (ASHP). 

The first two posts will deal with GSHP’s then I’ll cover ASHP’s and in a final post I’ll look at the often stated aim of nationally replacing domestic gas heating with heat pumps. I'll show what I think are some extremely serious financial and electrical issues society will have to deal with if a mass adoption of heat pumps were to be seriously attempted.

Ground Source Heat Pumps. (GSHP)

By any measure, for a normal family installing or updating  their domestic heating with a GSHP, it will be an enormously expensive operation. In addition to the basic installation costs there are also other significant costs that are, if not hidden, quite obfuscated.

The Energy Saving Trust estimated the cost of installing a GSHP in a typical family home at between £14,000 to £19,000. (HERE)

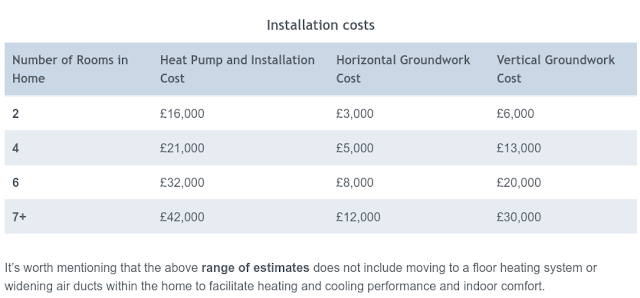
Selectra (HERE) give a slightly higher but more detailed cost break-down

Ground Source Heat pump installation costs

Notice from the above Selectra chart, a bore-hole system (which intuitively feels like the less costly of the two techniques) actually involves over twice the ground work cost of a horizontal system.

So the cheapest GSHP system will involve installing an underground pipe network under your garden. This means your home has to fit the following criteria:  

    • You have a garden (which will be trashed and need relaying)

    • It is accessible for heavy machinery

    • It is on a sufficiently pliable bedrock/soil

    • Your garden is big enough.

With regard to garden size The Ground Source Heat Pump Association (HERE) claim the following:

“As a general guide, for a newly built 3-bedroomed house of around 120 m with a heat loss of around 6kW, two trenches of 30-40 metres in length would typically be required.”

Note “with a heat loss of 6KW”. I assume it equates to the output from the heat pump required to maintain a modern 3 bed house at around 20degC. 

That’s a tiny heating system! Maybe suitable for a new build conforming to all the latest building regulations regarding insulation but hardly likely to be adequate for existing housing stock.

I’d suggest the vast majority of the current UK housing stock would have a lot of difficulty maintaining warmth all year round with a mere 6KW and two forty meter trenches.

EverGreen Energy (HERE) suggest as a rule of thumb you need a garden size of:

"..roughly twice the total floor area of your home from every storey.

The Centre for Alternative Energy (CAT) (HERE) suggests you need 10m of “slinky coil” per KW and that a typical 8KW heat pump requires 400 sqm (20m x 20m). According to the CAT you need 5 meters between the trenches. 

I suspect that both the EverGreen estimate and the CAT estimate assume unrealistically thermally efficient housing. But never mind. We will run with it anyway.

So, how big are typical houses in the UK? Savilles (HERE) tell us what the average floor area per house type is. So using the “twice floor area of your house” rule of thumb we can get a rough idea how big a garden you need for installing a GSHP into each type of house.

Typical Detached House:

  • Floor area 152 sqm. 
  • GSHP area (twice house floor area) 304 sqm.
  • Minimum required garden size: 18m x 18m or 57ft x 57ft

Typical semi-detached house:

  • Floor area 93 sqm. 
  • GSHP area (twice house floor area) 186 sqm.
  • Minimum required garden size: 14m x 14m or 45ft x 45ft

Typical Terraced house:

  • Floor area 83 sqm. 
  • GSHP area (twice house floor area) 166 sqm.
  • Minimum required garden size: 13m x 13m or 42ft x 42ft

What percentage of the UK homes have gardens that big? 

In  fact from (HERE) 1 in 8 UK homes have no garden at all! Of those who have a garden, the median garden size (i.e. the size where half are bigger and half are smaller) is 188 sqm. Which suggests that houses whose garden (if they have one and including front and back) would be big enough is about one third of the total number of UK homes.

Of those with big enough gardens most will be homes owned by the more well-off in society. Especially in London and the South. Notice the NONE of the above fulfil the CAT requirement of 400 sqm for an 8KW heat pump.

If you then assume that only one space (front or back garden) could be practically used for the piping, I would suspect you would eliminate all bar 10% of homes. Of those, almost all will be older and more expensive properties.

So what about bore holes? 

Look at the Selectra table (above) that gives ground work costs. Notice that vertical ground work costs are at least double (with most approaching three times) the cost for horizontal systems. So while there would be less stress on garden area when installing a vertical system, there would be considerably more stress on the bank account. 

Also notice that nasty little reality check paragraph underneath the Selectra table. It details some (not all) of the building work that is excluded from the price estimates.

Water temperature

GSHPs can only efficiently heat water to around 40 degC rather than the typical 65 -70 degC of a gas system.  In just about all domestic scenarios GSHPs are less capable than condensing gas boilers. 

As a result of the low output water temperature you need to install (recommended by most) underfloor heating with your GSHP. Alternatively you could significantly increase the size of all your radiators.

Either way you trash your house. 

To cap it off most companies selling these systems also highly recommend you upgrade your homes thermal insulation as well (assuming that is that there is anything left in the bank account to pay for it)

From installation issues alone I would suggest that GSHP’s are wholly inappropriate for most properties in the UK. There will be exceptions. But they will be exactly that: Exceptions. Not the rule.

Lets not forget, all I have covered at this stage is the impracticality for installing GSHPs in most UK properties. 

I haven’t covered the practicalities in actually running the things yet. (that's in the next post). 

There is also the potential impact on the electricity grid if the proposed scenario of GSHPs and ASHPs replacing gas boilers ever came to pass. ( last post in this series)

The next post (on the problems with the day-to-day running of GSHPs) is HERE

Trump, Biden and Penalty Shoot-outs

Imagine the next presidential election in the USA was reduced to a single penalty kick at a soccer match.

The Democratic party are on the penalty spot lining up to take the penalty. 

In front of them lies a big wide open goal. 

The only defence is a bad tempered geriatric goalkeeper with Attention Deficit Disorder.

Everyone thinks it’s going to be a walk over. 

But, in some weird sense of fair-play the Democratic party has selected an even older geriatric to take the penalty kick. Worse still, the penalty kicker has (policy wise) been known in the past to kick the ball in the wrong direction.

Will he score? Will he in fact even manage to kick the ball? Or will his flailing leg miss the ball completely so he falls flat on his face?

Or maybe the ball will just dribble forward and stop short – just like the previous penalty kicker did.

But at least Biden isn’t the entitlement candidate. Everyone hates entitlement. As Bidens predecessor found out.

But at 77 (81 after one term) it hardly bodes well for USA (let alone the world) that this contest will be won by someone (either Republican or Democrat)  considerably the wrong side of “three score years and ten”.

Of course Biden is only there because the rest of the sane division of the Democratic party baulked at the possibility of suffering the same humiliation that was meted out to Clinton. Nobody wanted the job - except the loonies, and even then, their prime candidate was even older than Biden. 

Why didn’t anyone want the job? 

Because Trump (bad tempered geriatric and sometimes just plainly bizarre) was driving a booming economy. 

The job as Democratic Presidential candidate had the word LOSER written all over it. 

But somebody had to do it. So old Joe Biden stepped up to the plate to be the sacrificial offering to democracy. To that extent we should say good for him. At least he wasn’t a coward like the rest.

Then along came Covid-19. Trump, ambushed by “events” appears out of his depth.  

Today Trump is on the back foot. That big open goal is even bigger and now slightly downhill from the penalty spot.

But still, the Democratic party seems obsessed with some strange concept of giving the Republicans a chance. It has insisted on an all female short list for the Vice President role. 

The short list for this role is (to say the least) very important. With the President nominee at the end of his natural life there is a significant possibility that the deputy president will in fact become the President before the next four years is out. Excluding half of the potential candidates because they have the “wrong” reproductive organs seems hardly rational. We are not filling a quota here! But never mind.

There are people on this Democratic party short list who are clearly worthy of the position (IMHO this lady particularly) and undoubtedly they would have been there irrespective of their sex. But some of the candidates are so fashionably woke and divorced from the electorate (like Clinton was) that they could actively inhibit the penalty shot.

So in my humble opinion, the success or failure of the Democrats challenge to Trump will succeed or fail NOT on the quality of the geriatric presidential contenders but on the character and credibility of their running mates.

I reckon if the democrats choose Tammy Duckworth, (War hero, competent and popular) then they’ll win. Probably hands down. But if they choose one of the entitlement “woke” candidates on the short list - they’ll get hammered.

Anyway, that’s the view of a remote and distant Englishman. You may well ask: Why the hell is an Englishman commenting on an American election anyway? 

I’m actually tempted to agree with you. Why the hell am I? 

First of all I loved the image of Trump and Biden engaged in a penalty shoot-out. 
But I really decided to post it because the world is in the shit. 

The USA (like it or not - as you will) is the only country in the world capable of turning it around. So everyone must take an interest.

So for my American buddies: Let me remind you that the next president of the USA is going to be in their late seventies. De-facto. That’s Zimmer* frame territory.

So when you make your decision, fully check out the quality and integrity of the Vice Presidential candidate.

Factoring that into your decision would appear to be a very good idea.

* Zimmer Frame (UK)  = Walking frame (USA) . Thanks to Lee Alley for the translation!


Time to say Goodbye (again)

Well, That goodbye didn't last long did it? Tonight I felt the urge to post again. So logically the rest of this particular post is now irrelevant. 

Hey Ho.


So, it is time to say goodbye again. Maybe for a while. Maybe forever.

Frankly I am now just getting irritated with the continual dream-world fantasies of the energy-illiterate. I have had enough of them. Their solutions are based on ignorance and are reinforced by gross stupidity. I really cannot be bothered addressing their delusions anymore.

Then we have (at the time of writing) the Corona Virus lock-down. Of all things this has perhaps been the most vivid example of MSM bias and fear-mongering. Couple that to the obscene political jockeying and it is enough to put anyone off.

So these days I never seem to get the inclination to write a post.

I thought I would put up this one last post to signal that BilloTheWisp and his sub-ego (the one that actually does the writing) will take a break. Maybe I'll be back. Maybe not.

The existing posts will be left here. Some folk still read them! Hopefully they find them useful. After all, nothing has got better about the wind energy farce has it?

My Twitter activity will also reduce and may stop completely. This is because I have become increasingly appalled at the censorship and partisan bias that has come to define corporate social media outlets like Twitter and Facebook.

So, to all my mates wherever you are, keep fighting the good fight, especially for a sane energy policy.

To to all my derided and abused compatriots in the fight for UK self determination remember this:

Even with the spite, hatred and corporate fear mongering that has been channelled against you, just remember who won the Brexit vote.

You did! 😀

Self determination and Democracy are never cheap.

Do a tour of the Normandy graveyards if you ever doubt that.

Keep the Faith.

Farewell!

Comparing Covid-19 Deaths UK and Italy.

Today I heard Keir Starmer making political capital out of the rising death toll in the UK. He is not alone. He has been joined by many in the MSM in telling us (glee barely concealed) that the  UK death toll from CV-19 exceeds that of Italy.

This is not a contest. But it irritated me enough to make me look into the numbers myself.

The data/sources and my reasoning are below for each country. Mostly this is based on discrepancies between total death count this year and the rolling 5 year average.

The main takeaways from this post as as follows:

  • It appears the deaths in Italy from CV-19 are being massively under-reported. The under-reporting is almost by a factor of two. It also appears that no attempt has been made to rectify this problem to-date. So I believe that today (6th May) Italian CV-19 deaths are still heavily under-reported.
  • CV-19 deaths in the UK were originally under-reported as they failed to take into account care-homes and the community. I understand this was corrected in late April. The date range in this article pre-dates this change so I have compensated for care home deaths and community deaths and included them along with hospital deaths. 
As of today (imho) I reckon the numbers stack up more-or-less correctly for the UK. But not for Italy.

I fail to see how the MSM (let alone the Leader of the Opposition) cannot know this.

Incidentally (post posting update!) Reuters newsagency report HERE more-or-less concurs with my figures. In fact (hurts to say!) they beat me to it by a couple of days.

Italy

I am relying on most of the figures for Italy from this BBC ARTICLE. (Yes. The MSM's own data!)

Here the BBC states that from 20th February through to “end of March” (I assume that is and includes 31st March) Italy suffered 90,946 deaths from all causes.

All causes is CV-19, heart attacks, strokes, cancer, accidents and everything else.

The rolling five year average for all-cause deaths during the same period in Italy is 65,592.

Which gives an excess death count of 25,534 (from 20th February up to & including 31st March) this year.

So how many deaths were actually flagged up as being caused by CV-19 during this period?

Sadly the BBC leave that bit out. (And why did they do that I wonder.)

From https://www.worldometers.info/coronavirus/country/italy/  we get this graph:

Incidentally this concurs with the Statista graph HERE:

The number of deaths recorded from CV-19 during 20th February to 31st March in Italy was 12,428

This is less than half the total excess deaths recorded from all causes.

As the Italian health service was at times overwhelmed, it is likely that some of these extra 25,000 mortalities were from causes other than CV-19 (Heart attacks/strokes etc) that went unattended.

But it would seem highly likely that only a small proportion of  these extra 25,000 deaths were from non CV-19 causes.

I would suggest that the excess deaths from non-covid-19 causes would be about at maximum 15%. That would give us an excess death count caused by Covid-19 of about 21,250 over the period 20th February through to 31st March in Italy. Not 12,428 as reported.

So it would look like the Italian death count for Covid-19 from 20th February through to the end of March is under-reported by around 9000 to 10,000.

So do these missing 10,000 deaths get added later on?

That looks impossible. Look at the curve on the worldodometer graph. While a few deaths will always be reported late there is simply no room to accommodate 10,000 pre 31st March deaths in another later time period without significantly changing the graph shape.

In fact the graph shape suggests that this counting scheme used up to 31st March is still in place.

If that is so then the real death toll from Covid-19 in Italy up to today (6th May) is more like 40,000 – 50,000.

UK.

The BBC article unfortunately does not give hard dates for the UK period of “6 weeks” but states that it started from the first UK CV-19 virus death. This death occurred on the 28th February. Six weeks later is 10th April.

(Incidentally this is two days longer than the equivalent Italian period - but never mind)

The BBC informs us that the total number of deaths from all causes during this period was 89,735. The rolling five year average for total deaths during this calender period is 72,812. Which gives us an excess death total of 16,923.

The NHS total of CV-19 deaths (NOT the full total) up to 10 April is given in the graph below as 10,760. (from HERE)


So at this point we are left with 6,000 excess deaths unaccounted for.

This weekly summary from the ONS for deaths during week ending 17th April (HERE) indicates that up to week 16, 77.4% of deaths from CV-19 occurred in hospital. Which would mean that 22.6% occurred in care-homes and the community.

Although the statement is first reported in the PDF for week 16 (17th April) rather than week 15 (10th April) it would seem reasonable that the percentage death by location would be very similar on a weekly basis.

So if 10,760 deaths from CV-19 occurred in hospitals up to 10th April it militates that the real death count from CV-19 (including care homes and the community as well as hospitals)  was 13901.

Which now leaves an excess of just over 3000 unaccounted for.

Although the NHS has not been overwhelmed (unlike the Italian health service was) it has delayed/cancelled/postponed procedures.

People were originally encouraged not to go to hospital. Consequently people were either frightened of catching CV-19 or simply did not wish to burden the NHS further with their CV-19 unrelated problems. Hospital attendances fell off a cliff. Some died as a result.

If (like Italy) we assume 15% excess deaths are due to extra heart attacks/stroke deaths we get down to 915 unaccounted deaths over this 6 week period.

This is small enough to get lost in the noise of rolling 5 years averages. But even if you assume they actually were unreported Covid-19 deaths then that would give an under-reporting in the UK of a mere 6% compared to Italy’s under reporting of 70 – 100%.

Then finally we come to population size and density. The UK has a 10% larger population than Italy. UK population density is 30% higher than that of Italy.

So I think it would be reasonable to say that the deaths from CV-19 per capita in Italy are twice as high as those in the UK.

But this is not a contest.

This is a tragedy.

Maybe Mr Starmer should keep that in mind next time he goes to make political capital out of the misery of his countrymen and women.

Insects and a new Silent Spring

There is a hidden on-going man-made environmental catastrophe taking place today.  It rarely gets mentioned. If does get mentioned the cause is deliberately misrepresented. Mostly though, it is ignored. Swept under the carpet. In the hope that nobody will notice.

This calamity directly leads to the destruction of 1.2 trillion flying insects each year in Germany alone. A calamity that could lead to a massive and potentially irreversible decline in agriculture and wildlife.

The 1.2 trillion lost flying insects is a tiny part of the overall German insect population. But it is most certainly not insignificant. By comparison it equates to about one third of the entire migrating insect population in southern England.

The crucial aspect of these 1.2 trillion insect losses are that they are flying and migrating insects. They are mostly at the adult stage and are going to breed. Predatory losses among insect larvae and young adults are usually well in excess of 90%.  Trivialising the loss of these 1.2 trillion adult insects by comparing their number to the overall insect count (as some do) is foolish.

If you impact the relatively small numbers that actually reach the breeding stage, you will potentially cause a population collapse. Not only in the insects themselves, but later within the insect predators. The main insect predators are birds and other arthropods (mainly spiders) so don't be surprised when they start disappearing too.

This annual loss has been happening over a decadel time-scale. This catastrophe works a little like compound interest in reverse. Initially the effect is small. But the predators continue to eat. Until that is, they themselves are unable to find enough food. So as each year goes by, the effect builds on itself.

Today in some parts of Germany the flying insect population has collapsed by 75%. Where there is one flying insect today, in 2000 there were four.


When you have a situation like this you expect to see a smoking gun.  Some change that has been made within this short timescale. A change that correlates with the decline. Something that already has a track record in causing insect death. Then surely it would be sensible to highlight it as the potential cause.

You only ever miss seeing such a murder weapon if it is being hidden from you. Or alternatively, your cognitive dissonance insists that one of your cherished icons could never cause such wanton destruction.

Both of these options seem to be in play today.

It is true not all of the insect population decline may be caused by this single but lethal mechanism. But there seems little doubt that it makes all other possibilities (aka Climate Change, insecticides, wet weather, traffic) pale by comparison. Here’s a table of possibilities and their calculated impact. Notice the big bar labelled “Unknown”. So big in fact that it has its own scale.


So it looks like our smoking gun is "Unknown". But what has arrived since 1990? Further more what is known to destroy insects en-masse? In fact what is known to destroy insects in such numbers that the insect DNA residue smeared over its surfaces can inhibit its operation? What has grown in number as the insect population has declined?

So before I announce the murderous methodology of this wanton  man-made destruction let me first link you to two peer reviewed scientific papers both published in prominent and respected scientific journals. As well as that I'll first link in a Nature article from 2001. All the graphs/images on this post are taken from the peer reviewed papers.

Why am I doing this first?

Because what I am about to tell you will possibly cause you a great deal distress. I don't want you to discard this this information simply because it seriously challenges your world view. Here they are: (notice the oldest dates back to 2001 – this has been known about for a long time – and covered up)


So, the titles of the papers possibly tipped you off regarding the mechanism that is destroying wildlife on such a grand scale. But if you missed it, the smoking gun appears to be:

The wind turbine.

Or rather the 30,000 wind turbines that scar the face of German countryside. This is what they do:


The murderous effect of wind turbines on insect populations has been known about for at least twenty years. Nothing has been done. In fact the problem has been obfuscated, ignored and otherwise covered up by the wind industry.

I first blogged about it nearly seven years ago HERE . But back then I had no idea how bad the problem was.

But it gets worse.

It appears the greatest danger wind turbines present to insect populations is when the wind is low and the turbines are in effect idling. They will be producing little or nothing except the slaughter of billions of insects a day.

So why are they turning? Why have they not been braked?

Vanity.

The wind turbine lobby love to pretend that wind turbines are producing energy even in low winds. What they do not tell you is that the amount produced in low wind is so pitifully small it might as well not be generated at all. It is most certainly not worth decimating the worlds insect populations on which the whole eco-structure of the world depends.

An immediate imperative to mitigate this evolving insect cataclysm is for wind turbines to be stopped when the wind speed is low. This needs to be done NOW.

Then we really need to take a long hard look at these fashionable yet massively counter-productive and sub-optimal  “green” energy mechanisms.

This insect murdering wind turbine calamity could (and possibly already has) cause irreversible damage to both the larger environment along with agriculture and biodiversity.

Please read the papers (especially the one by Trieb) They may be dry but they are vital if we are going to recover from this calamity

On a personal note I would like to say that I don’t scare easily. I generally view end-of-the-world or cataclysmic viewpoints with disdain.

But I find Trieb's paper alarming. What makes it so alarming is that it is a worthy, peer reviewed and momentous paper. There is no hidden agenda. No half-truths. No obfuscations. In fact I could well imagine that Trieb has taken an enormous amount of flak from vested interests already.

Yet Treib's paper is not only being ignored it is being stonewalled and denied without any form of valid refutation.

To use a phase: We need to listen to the science. Then we need to discard the wishful thinking.

Particularly we urgently need to listen to THIS science and listen to it whether we like it or not. There is no excuse to ignore this.

In low winds these fatuous fashion statements must be stopped from turning.

We must stop this evolving insect catastrophe.

Before it is too late.

An Inconvenient Ruminant

The inconvenient ruminant in question is the North American Bison, colloquially known as an American Buffalo.

An American Bison [wikipedia: Jack Dykinga]
The American Buffalo is a potent symbol in the USA and Canada. They have been called Buffalos since the very first European settlers arrived in the mid 1600’s and generally that is what they are known as today.

In fact there are two different subspecies of American Buffalo. The Plains Bison and the Wood Bison. Both are large animals with the Woods Bison being among the biggest of bovine animals in the world and certainly the biggest land animal in the Americas

The American Bison is undoubtedly a magnificent wild beast. But as a species they presents a bit of a problem for Vegan and other Climate Change fanatics like Extinction Rebellion. These are the people who are seeking to reduce/ban/outlaw meat eating on some half-baked delusion that disavowing meat and substituting (say) Mung beans will save the planet.

Let me tell you (with help from the history of the American Bison) why they are wrong.

But first let us just review what exactly the argument against meat production is, and why it is actually deeply flawed even without bringing the American Bison into the argument.

The general attack on the livestock industry these days centres around Climate Change and a blinkered mindset that somehow has convinced itself that animal husbandry is a "bad thing"

The main thrust of the Vegan/Extinction Rebellion argument is that domestic ruminants (mainly cattle) emit large quantities of methane. Methane is a known greenhouse warming gas with an immediate impact. Initially this impact is many times the forcing impact of an equivalent amount of Carbon Dioxide.

So you would think that the more cattle you had then the worse it would be. Over a decadel time-scale (ten years or so) and to an limited extent, that is true.

But Methane is a volatile gas and quickly breaks down in the atmosphere. It decays away exponentially. Within 18 months of a release half is gone. Within 12 years the amount left is immeasurable.

So if your ruminant herd size is stable then the warming effect from the methane release from this herd is stable. If you increase the herd size then it is true the methane release increases. But the warming effect from this increase stabilises within ten years. The net result is that for all countries with more or less stable ruminant herd sizes the contribution to global warming is already factored in. Further warming from these stable herds will be nil. Zilch. Nada.

If you want some proof of this then try this post on the British Veterinary Associations website HERE. But better still refer to the actual paper from Oxford University (IPCC researchers none the less) HERE.

Remember though. We haven’t got to the inconvenient history of the American Bison yet.

American Bisons come from countries (the USA and Canada) that the average Vegan zealot would regard as the arch-criminals of meat eating Methane production.

The USA has between 60 and 80 million cattle, all farting and burping (mostly burping) out their Methane like there was no tomorrow. But, as shown by Oxford University, if the herd size is stable, all that warming from Methane is already factored in.

This is not a gaseous Armageddon in the making. But it gets even more interesting. In fact on an historical timescale there is a reasonable chance that total ruminant emissions, (including the millions of domestic cows) may well be lower now than it was 400 years ago.

How come?  It comes down to a (real) man-made ecological disaster that befel the American Bison in the 19th century.

American Bisons or Buffaloes (call them what you will) were nearly hunted to extinction from around 1830 through to 1880.

By 1880 there were less than 1000 American Buffalos left. Luckily, even in those dark days there were people who recognised the importance in preserving these magnificent beasts.

The American Plains Buffalo was rescued from the brink of extinction. The Woods Buffalo though was feared to be extinct for over 70 years.

Then by sheer luck a herd of 200 were found in a remote part Northern Alberta in Canada in 1957.

Today in total there are about 500,000 American Buffalos in existence. Their recovery from the brink of extinction is an epic tale and something we should all be proud of. Just as we should be truly appalled how they got to the point of extinction in the first place.

So what? You may ask. How does this relate to methane release?

One simple figure should tip you off.

Remember those 500,000 American Buffalos that exist today?

Well, that number is probably less than one per cent of the estimated herd size back in 1700.

Back in 1700 the American Buffalo herd size has been estimated at being between a low of 30 million and up to 75 million. There is even a possibility it topped 100 million. A total herd population of 60 million seems to be the consensus estimate. The herds of Buffalo once stretched from down in Miami right up to Alaska.

The net result of the hunting carnage in the 19th century is that today the methane emissions from the domestic American cattle herd is largely offset and maybe completely offset by that from the slaughtered (and now missing) 60 million American Bison.

So cattle ranching in the USA and Canada has in reality only brought ruminant methane release back up to around that in pre-settlement days.

Nobody suggests that the wanton slaughter of 60 million American Bison in the 19th century was a “good thing”. Far from it.

But it does mean that today the scare stories surrounding methane release from domestic cattle in the USA and Canada are at best over-blown.

At worst they are a myth.
------
Notes:

There is quite a good Wikipedia piece on the American Bison HERE

More information on methane release by Bison and other wild ruminants can be found in This Article

What looks like an interesting book (only skimmed it so far) from the 1890’s titled:

The Extermination of the American Bison 
by William T. Hornaday

Hornaday was the Superintendent of the U.S. National Zoological Park. It looks like he was one of the heroes who saved the day as far as the American Bison was concerned.

His book is available for free from the Gutenberg project on THIS LINK.


Domestic Electricity Prices & Wind Turbine Subsidies

Nearly nine years ago I wrote a blog post analysing the consumer electricity price differences between European countries. This was based on the table below which came from  THIS SITE.

The original post is HERE.

European Electricity Prices in 2011

The data was sobering. Especially with how the price appeared to track the level of installed wind power within the country.

I intended to update this on a regular basis but for some reason the website stopped making the data available. Eventually  I gave up trying and forgot about it.

By chance (as it is the year end) I was looking at the stats for this blog. I noticed that the old post on European electricity prices (now nearly nine years old) was still getting a fair amount of traffic.

So yesterday I went back onto the The European Energy Portal just in case they had any links to up-to-date data. The good news is that they have restarted providing the data. So now I can at least (after a delay of eight and a half years) update the original.

The readings today, after nearly nine years of rampant and virtually unconstrained development of industrial wind turbines and other RE make for even more sober analysis than before.

Here’s the new table of European electricity prices.

European Electricity Prices 2019


You will notice that the relative price between countries is virtually unchanged. Denmark still hosts the most expensive household electricity. Germany is again a close second. Sweden is today marginally cheaper than France but both have undergone significant price increases. Especially France which has politically disavowed its clean cheap and effective nuclear power in favour of yet more wind turbines.

Bulgaria still has the cheapest electricity in Europe with a virtually unchanged price. Interestingly Austria has also maintained its 2011 price.

Many European countries though have suffered large real-value increases in the price of their electricity. Often well above inflation.

The UK is a case in point. The is a period of eight years between the original post and the updated table. The price (in Euros) over this time went up from 15c to over 22c. That’s a rise of over 7c or a rise of about 50% unadjusted for inflation.

FROM HERE price inflation in the UK since 2011 to 2019 was 21%. So the rise in electricity prices in the UK over this eight year period has on average been at more than double the annual rate of inflation.

So why is this?

Maybe gas prices have gone up? (gas accounts for about one half of UK electricity generation)

No.

The gas spot price is actually cheaper today than it was in 2011, and by a considerable margin.


Is nuclear adding to the cost?

No.

In fact what nuclear there is left is now more efficient and cost effective than ever. Today nuclear power offers the cheapest electricity on the UK market.

Coal as a major UK electricity generating fuel is no more. It is a bit part player. Besides, the coal price (like the gas price) is considerably lower today than in 2011.

But there is a large new added cost since 2011 and that cost is associated with Renewable Energy.

There’s been lots of smoke and mirrors about how “cheap” wind power and solar have become but you only have to dig a little way into data to show the truth.

As the years have gone on the amount of subsidy to wind turbines you provide from your electricity bill has steadily gone up.

It is the old “boiling frog” approach to implementing a considerable price hike over time.

Disguised by the natural fluctuation of the market due to fuel price changes the price of electricity has been slowly and carefully ratcheted up over many years.

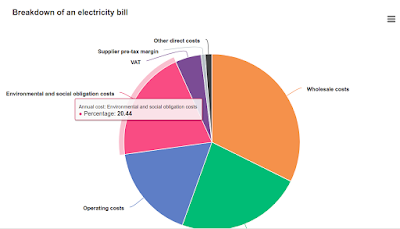
Today for every five pounds you spend on your consumer electricity bill, one pound is allocated to what is known as “Environmental and social costs”.


According to OfGem:
[quote]
These are the costs of government programmes to save energy, reduce emissions and encourage take up of renewable energy. 
[unquote]

Of that 20%, the Lions share is used provide subsidy payments to Wind turbine operators and and solar PV owners. Mostly it goes on wind turbines.

The vast majority of these subsidy payments are made through what are known as ROC certificates. This is a subsidy scheme that is now obsolete but will still impact your bill for the next 20 or so years.

The RO scheme has been replaced by an even more duplicitous (and still lucrative) scheme called Contracts for Difference. But as of today ROC payments form the majority of wind turbine subsidy.

In other words the majority of the 20% added to your bill as “Environmental and Social Costs” is the amount you pay to subsidise wind turbines and to a lesser extent solar PV.

Paltry amounts out of this 20% go to improving home insulation or to providing remote locations with electricity.

So, you may be surprised to find that your annual electricity bill shows far less of an increase than  this boiling frog price hike suggests.

This is because people now use less electricity than in 2011.

Why?

Because today we have more efficient appliances, particularly electric light bulbs, but white goods are much better too.

So just think:

All that money you spent on LED bulbs and eco-friendly washing machines has been used not to reduce your electricity bill, but to line the pockets of the big companies running wind turbines. 

And it will continue to be used in the same way for the foreseeable future.

Today for every MWh of electricity produced the generating company must provide 0.484 ROC certificates. The value of a ROC certificate in 2020 has been set at £48.78 per ROC. This cost is passed directly through to the customer.

A typical consumer uses 3.7MWh electricity per year. Maybe you use more. Maybe less.

So work it out yourself how much you are subsidising wind turbines by.

I don’t think you will be amused.